Measuring comment moderation: the numbers worth tracking every week
Eight numbers tell you whether your comment sections are safe, answered and getting easier to run. Here is what each one means, how to calculate it, what a change usually points to, and a 15-minute weekly review.
Guides 5 min read
On this page
Most teams judge comment moderation by feel. A quiet week feels good, a week with an angry thread feels bad, and neither says whether your comment sections are actually safer or your customers better answered than a month ago.
A handful of numbers, looked at the same way every week, fixes that. None of them needs a benchmark from someone else's brand. The only comparison that matters is your own last week, and last month.
The eight numbers
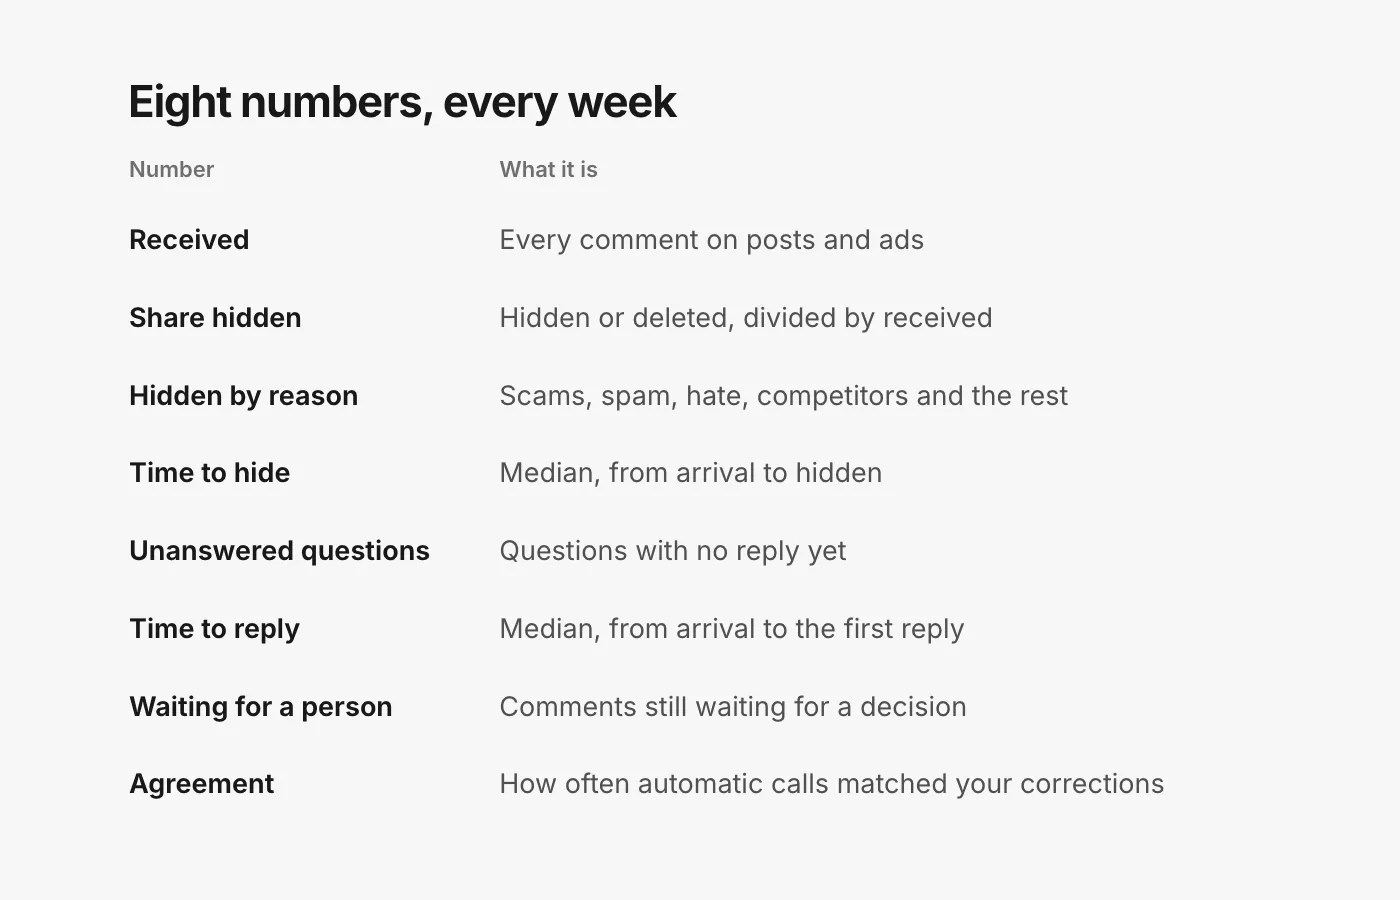
1. Comments received
Every comment on your posts and ads, split by platform and by posts versus ads. It is context for every other number: a jump in hidden comments means something different when comments doubled. Ads usually drive the swings, because spend and creative change faster than your posting schedule.
2. Share hidden
Hidden (or deleted) comments divided by comments received. Watch it as a percentage, not a count. A rising share on one ad usually means that ad attracted scammers or a pile-on. A rising share everywhere, with no change in what you post, can mean your rules got stricter, sometimes by accident.
3. Hidden by reason
The same hidden comments, grouped by why: scams, spam, hate, competitor mentions, links and so on. This is where trends show up first. A week where scams double tells you to check for impersonator accounts and warn customers. A week where competitor mentions double may mean a competitor is running ads at your audience.
4. Time to hide
How long a harmful comment stays visible: the median time from when a comment arrives to when it is hidden. Use the median, not the average. One comment hidden two days late (because nobody saw it over a weekend) drags an average far away from what usually happens, while the median shows the typical case. Then look separately at the slow ones, because those are the scams people actually read.
5. Unanswered questions
Questions from people who are about to buy, or already have, that have no reply yet. Count them at the end of the week and look at where they are: questions under ads are costing you sales while they wait.
6. Time to reply
The median time from when a comment arrives to your first reply. A question answered in minutes gets read by everyone who has the same question; one answered the next day mostly does not. Split it by who replied (your team, drafts approved by your team, or automatic replies) to see where the time goes.
7. Waiting for a person
Comments that need a decision and have not had one: the backlog. If it grows week after week, either too much is being sent to people, or nobody owns the queue. Both are fixable, but they need different fixes.
8. Agreement
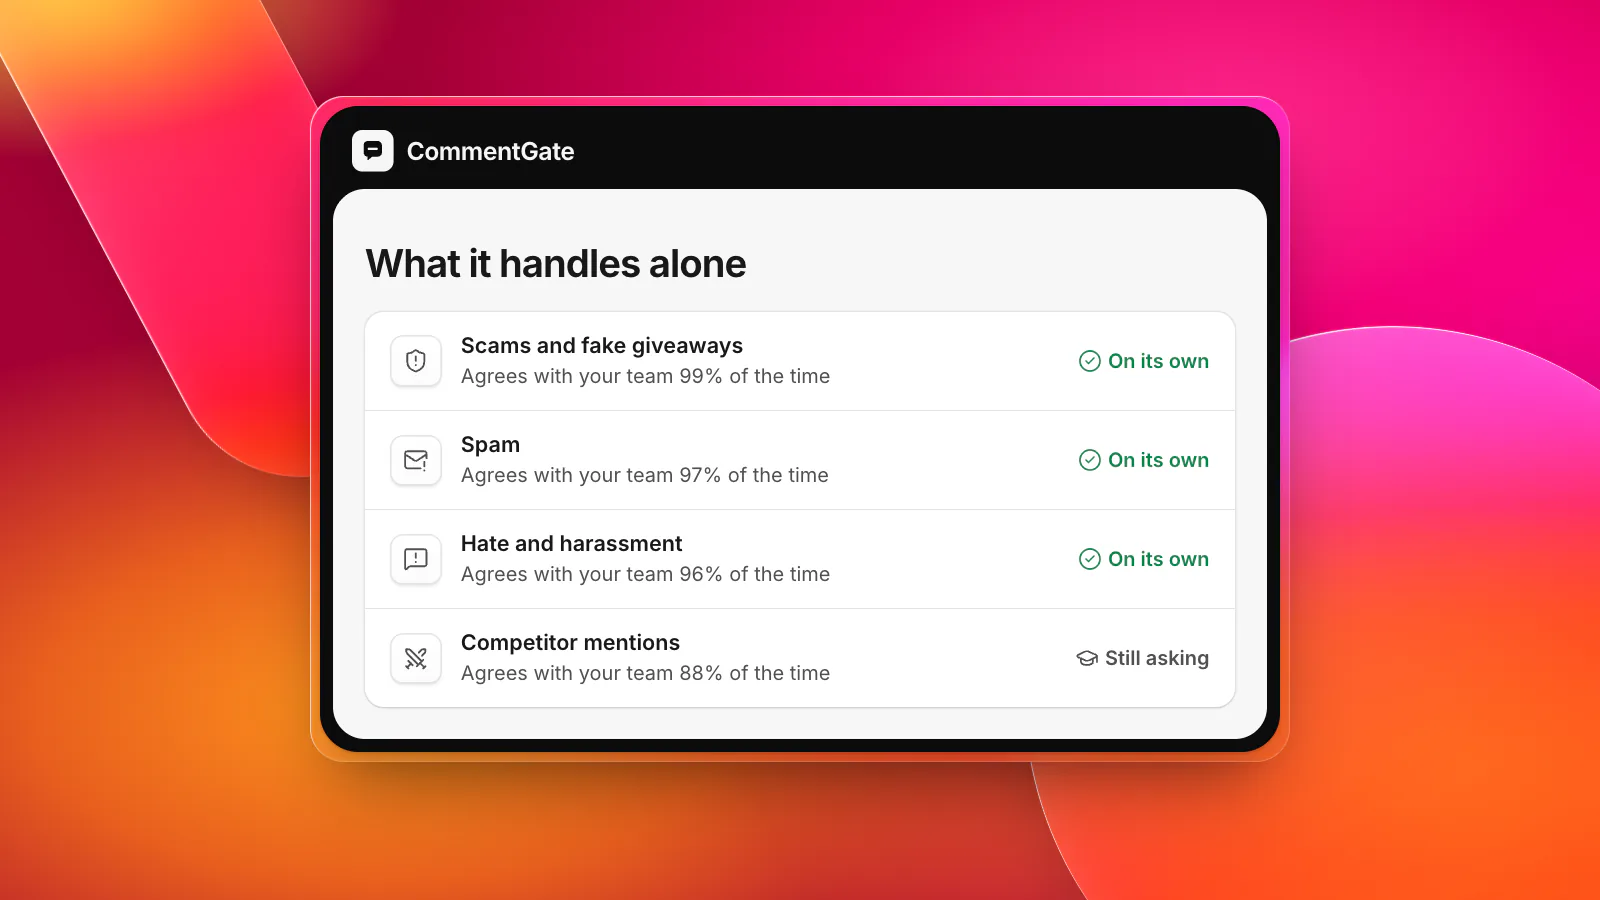
If anything decides automatically, how often its decisions match what your team would have done. The simplest version: of the comments where a person later looked (unhid something, hid something, answered a question), what share did the person agree with? Falling agreement means the automation needs correcting before you trust it with more. Rising agreement is the evidence to hand it more. Our guide on when to automate and when a person should decide covers what to do with that evidence.
Reading the changes
Numbers only help when a change leads to an action. A few common patterns:
- Share hidden up, received flat: a scam or spam wave, often on one ad. Check which ad, and look for impersonator accounts (fake support accounts and impersonators).
- Received up sharply, negative comments up with it: read the thread before anything else. It might be a shipping problem, a bad batch, or a post that landed wrong. That is a crisis day, not a moderation problem.
- Time to reply up, unanswered questions up: the questions are the same as always, but nobody has written the answers down. Write the top five as saved answers.
- Waiting for a person up, everything else flat: too many borderline comments are being sent to people, or one person is out. Check who owns the queue.
- Agreement down in one area: corrections in that area are disagreeing with the automatic calls. Read the recent corrections together; there is usually one pattern, such as fair product comparisons being counted as competitor mentions.
A 15-minute weekly review
Pick a fixed time, such as Monday at 10 a.m. Eastern, and go through the same steps each week:
- Write this week's eight numbers next to last week's.
- For anything that moved a lot, write one line on why. If you do not know why, that is the thing to look into.
- Read five hidden comments at random. Unhide any you disagree with.
- Read the unanswered questions and answer them, or assign them.
- Pick one change for the coming week: a new saved answer, a switch, a line of guidance, a person to own the queue.
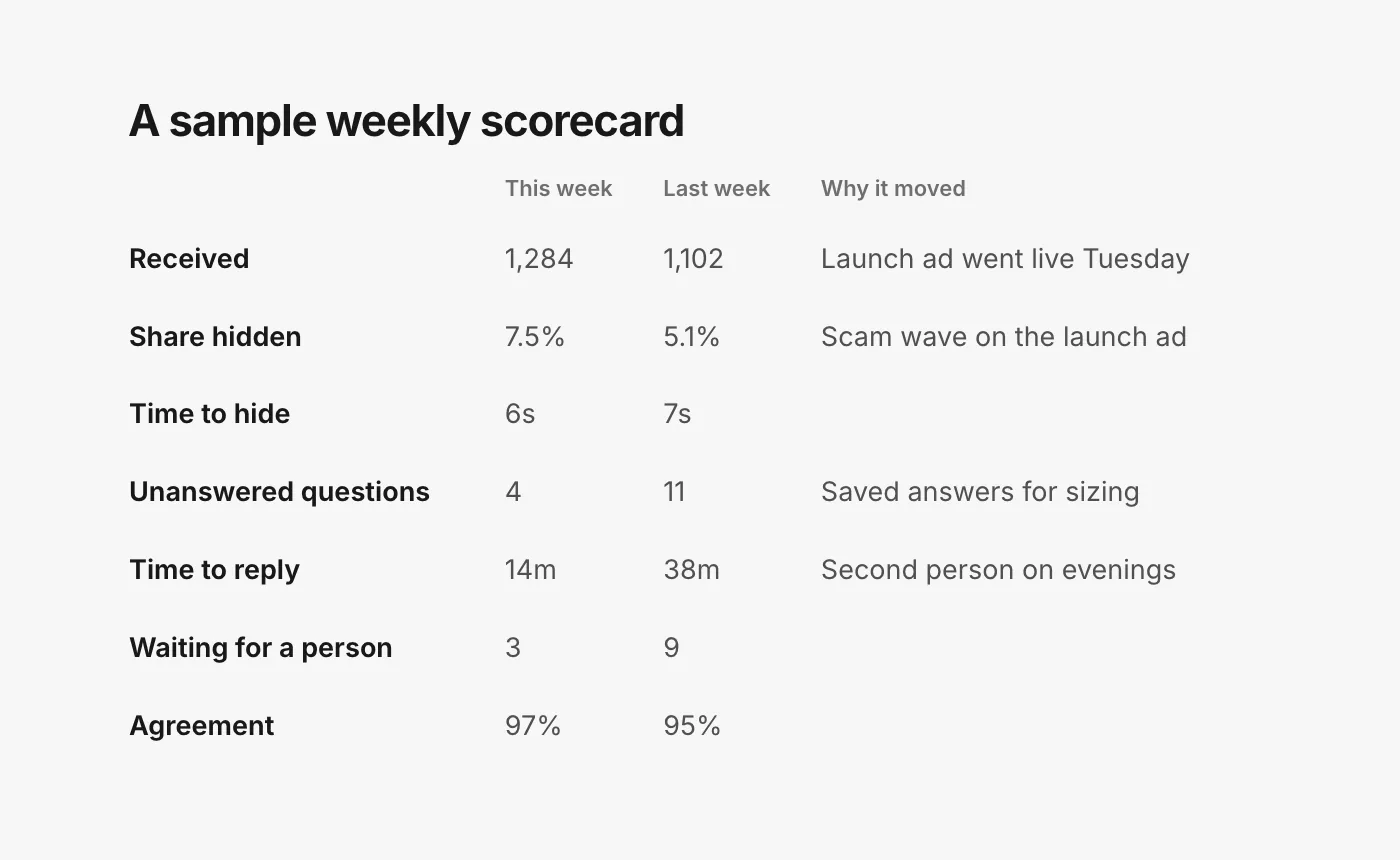
After a month you have four rows of numbers and four notes on why they moved, which is more useful than any benchmark. If you report to a client or a manager, the same scorecard is the report.
Numbers to leave out
Some numbers are easy to count and tell you little about moderation:
- Total comments as a goal. More comments is not better moderation. A giveaway post can triple comments and fill them with spam.
- Comments hidden as a win. A higher count can mean more scams, or stricter rules hiding real customers. The share hidden, read next to hidden by reason, says which.
- A single sentiment score. One number for "how people feel" hides the detail you need. Count complaints and read them; the themes matter more than the score.
- Averages of anything with a long tail. Response times are the classic case. Use medians, and look at the slowest few by hand.
Where to find them in CommentGate
If you use CommentGate, every number above is counted for you, in your workspace time zone:
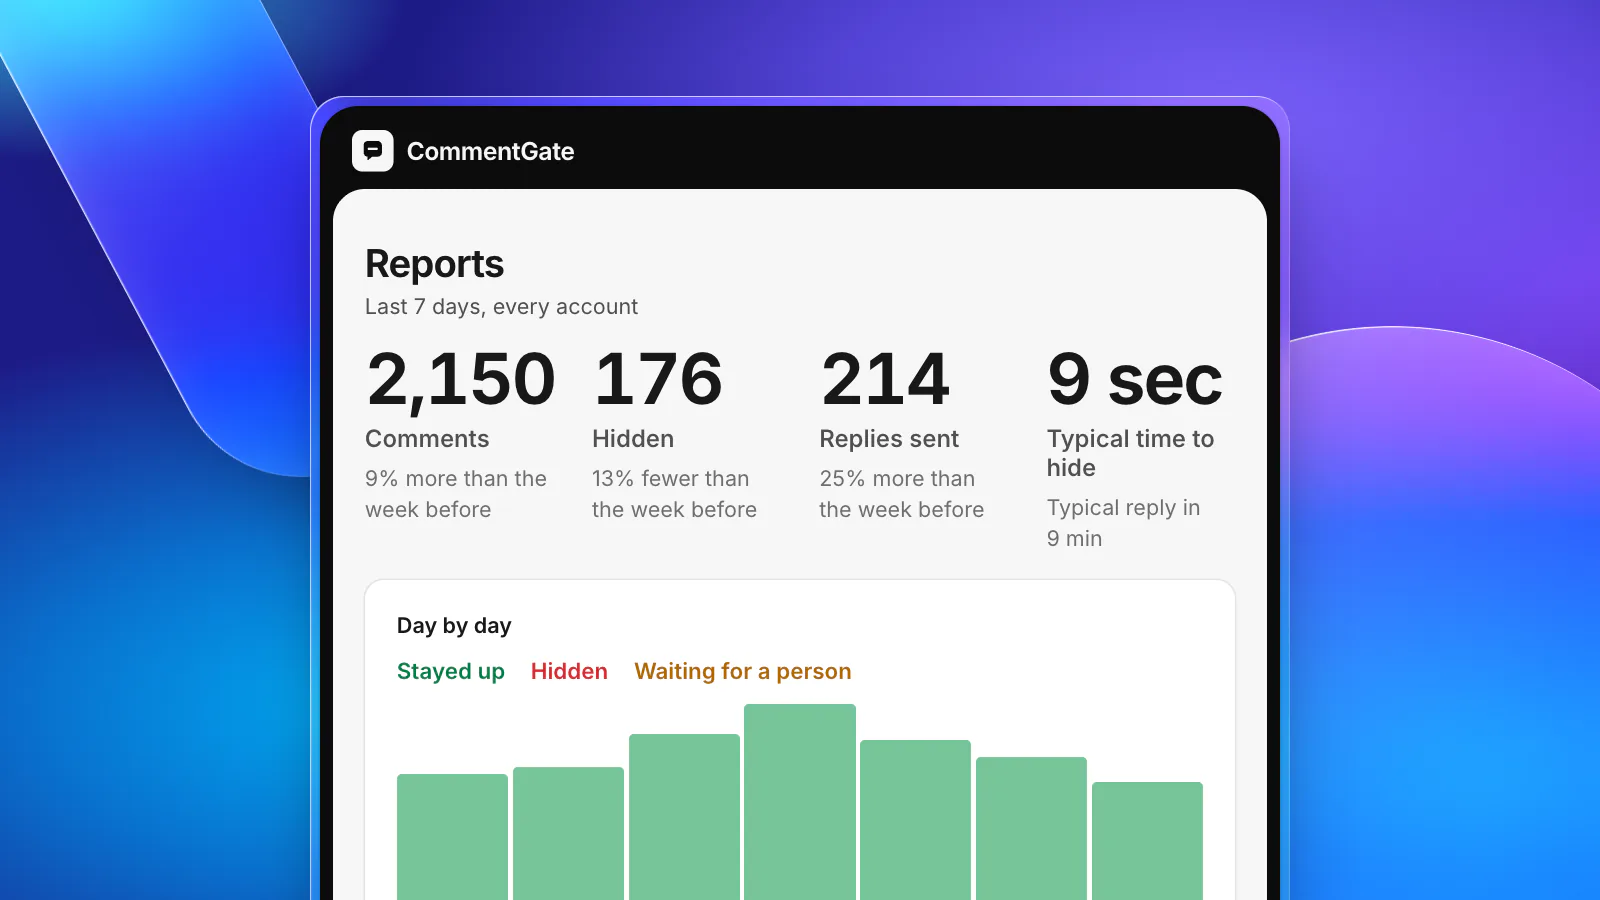
- Reports, Overview: comments received (and how many stayed up), hidden or deleted as a share of received, waiting for review, replies sent, and the median time to hide and to reply, both measured from arrival. Filter by platform, account, posts or ads, and any date range, and download the comments as a CSV.
- Reports, Team: replies by your team, drafted by CommentGate, and sent automatically, with the median time to reply.
- Reports, Ad health: per ad, the share of harmful and negative comments against the previous week, and unanswered questions.
- Reports, Insights: praise, questions, complaints and unanswered questions for the week, with the themes behind them.
- Home: the week's status: how many comments it decided, the share it handled on its own, the share it asked you about, and agreement with your corrections, against the week before.
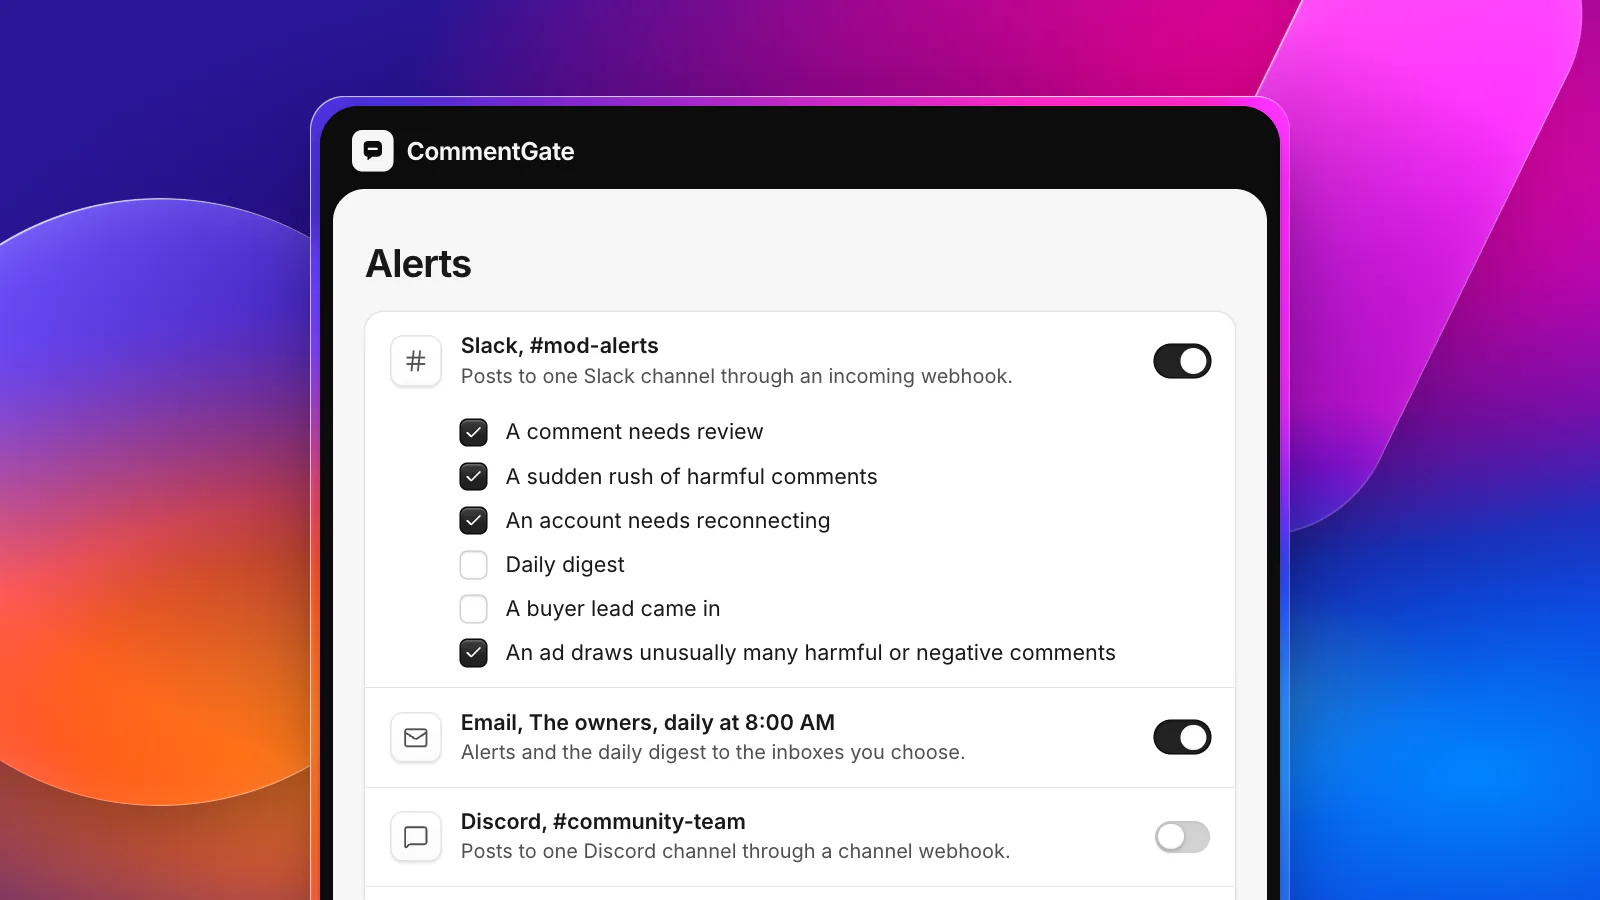
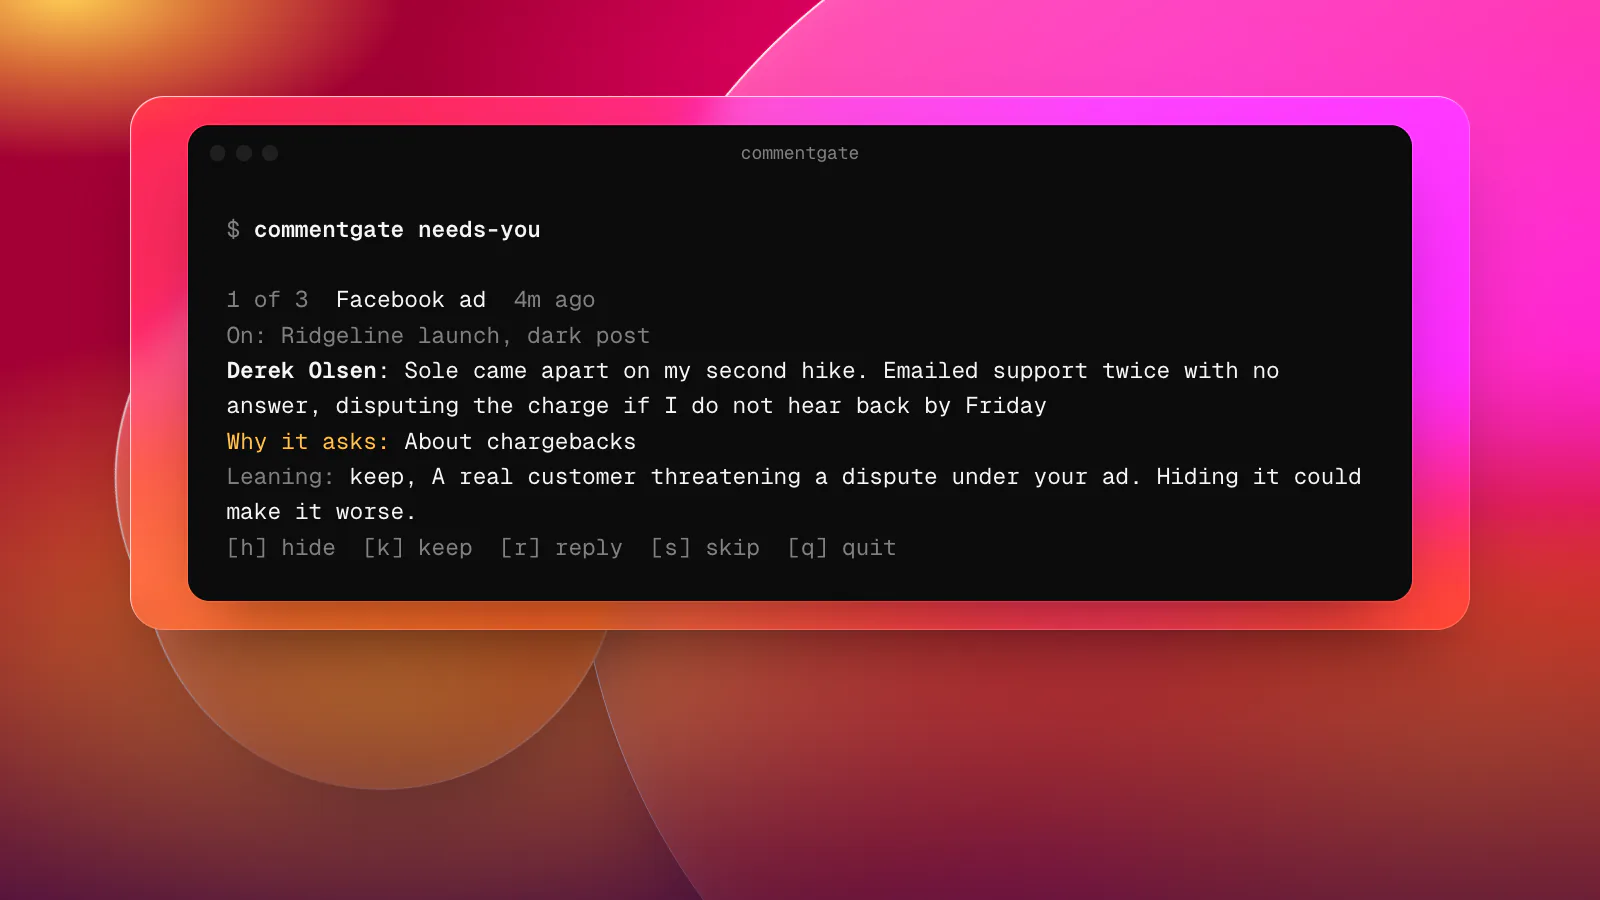
You can also have the numbers come to you. The daily digest arrives at the hour you choose, and weekly customer insights arrive on Mondays, by email, Slack or Discord (Settings, Alerts). For your own spreadsheet or dashboard, the same totals are available from the reports API and from the command line with commentgate reports --last 7d --json (the commentgate CLI).
Agencies can send clients a branded version of the same numbers; see the agency playbook.